Detection probability versus C/N0
This page records the probability that acquisition finds a NavIC S-band SPS signal at the right place, as a function of its carrier-to-noise density ratio C/N0, for four receiver conditions (GitHub issue #2). These curves are the simulated reference that the conducted test of milestone M3 will be compared with.
What is measured
For each C/N0 value, snappnt sweep generates a snapshot with one satellite (PRN 10) and runs
acquisition on it, 200 times. In each trial it draws new values of:
- the code phase (uniform over the 1023-chip code),
- the carrier phase (uniform over 0 to 2π),
- the noise seed, and with it the data symbols and the position of the first symbol edge.
The Doppler is not drawn: it stays at the scenario value, 0 Hz, and the carrier offset is set only by the scenario's clock error.
A trial counts as a detection (p_detect) when the detection metric exceeds the threshold
and the peak is within 0.5 chip of the true code phase and within one frequency bin of the
true carrier offset. A trial whose metric exceeds the threshold at any other place counts as
a wrong detection (p_wrong), not as a detection. The threshold is set for a false-alarm
probability pfa = 1e-3 over the whole search grid; see
False-alarm rate versus the configured pfa for how well that holds.
Conditions
| Scenario file | Sample rate | Snapshot | Quantization | Clock error | Blocks (B) | Frequency search | C/N0 grid |
|---|---|---|---|---|---|---|---|
navic_s_esp32c3.yaml |
80 MSa/s | 16 384 samples (about 0.2 ms) | 10 bits, 12 dB AGC backoff | 12 ppm | 1 | ±40 kHz | 46–60 dB-Hz |
navic_s_ideal.yaml |
8.184 MSa/s | 32 736 samples (4 ms) | none | 0 ppm | 1 | ±2 kHz | 30–46 dB-Hz |
navic_s_esp32c61_4msps.yaml |
4 MSa/s | 16 384 samples (about 4.1 ms) | none | −8 ppm | 1 | ±40 kHz | 30–46 dB-Hz |
navic_s_esp32c61_4msps.yaml |
4 MSa/s | 16 384 samples (about 4.1 ms) | none | −8 ppm | 4 | ±40 kHz | 30–46 dB-Hz |
- B is the number of blocks the snapshot is cut into; the blocks are correlated separately and added in power (non-coherent integration). With B = 4 on the ESP32-C61 condition each block is about 1 ms long.
- The ±40 kHz search covers the carrier shift caused by the clock error at 2492.028 MHz:
about −29.9 kHz for 12 ppm and about +19.9 kHz for −8 ppm.
navic_s_idealhas no clock error and no Doppler, so ±2 kHz is enough there; this is the range used intests/test_loopback.py. - The frequency step is the default of
acquire, 1/(2T), where T is the length of one block. - C/N0 grid in 1 dB steps; 200 trials per point;
--seed 0. - The ESP32-C61 scenario assumes an ideal decimating filter before the 4 MSa/s sampling. If the low sample rate is produced by clock division without band limiting, noise folds into the band and the curves move to higher C/N0. That effect is studied in issue #3 and is not included here.
Results
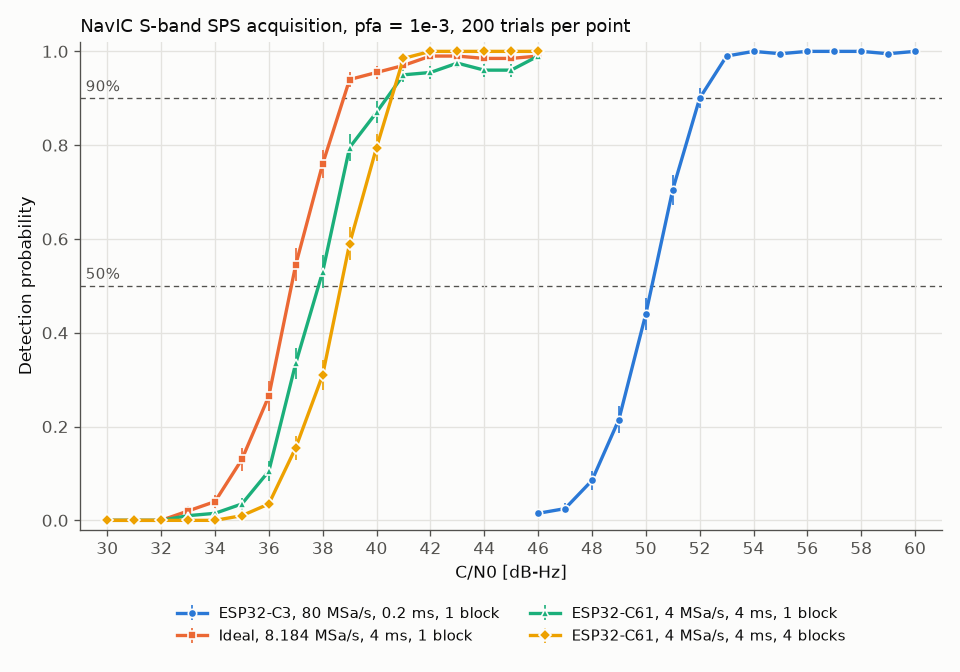
Error bars are ±1 binomial standard deviation, sqrt(Pd (1 − Pd) / 200).
The 50 % and 90 % points are found by linear interpolation between the two adjacent grid
points where p_detect first reaches 0.5 or 0.9. With 200 trials the standard deviation of
p_detect near 0.5 is about 0.035, which at the observed slopes of 0.2 to 0.3 per dB
corresponds to roughly ±0.2 dB on the 50 % point.
| Condition | 50 % point | 90 % point |
|---|---|---|
| ESP32-C3, 80 MSa/s, 0.2 ms, B = 1 | 50.2 dB-Hz | 52.0 dB-Hz |
| Ideal, 8.184 MSa/s, 4 ms, B = 1 | 36.8 dB-Hz | 38.8 dB-Hz |
| ESP32-C61, 4 MSa/s, 4 ms, B = 1 | 37.8 dB-Hz | 40.4 dB-Hz |
| ESP32-C61, 4 MSa/s, 4 ms, B = 4 | 38.7 dB-Hz | 40.6 dB-Hz |
All four curves reach 0.9 inside their C/N0 grid.
Data files (columns cn0_dbhz, trials, p_detect, p_wrong, mean_metric):
- pd_navic_s_esp32c3.csv
- pd_navic_s_ideal.csv
- pd_navic_s_esp32c61_4msps_b1.csv
- pd_navic_s_esp32c61_4msps_b4.csv
Comparison with the early estimates
The first version of the repository gave rough numbers from 20 trials per point
(docs/project/milestones.md). The difference below is the distance from the measured 50 %
point to the nearest end of the estimated range.
| Condition | Early estimate | This page | Difference |
|---|---|---|---|
| ESP32-C3, 50 % point | 50–51 dB-Hz | 50.2 dB-Hz | 0 dB (inside the range) |
| ESP32-C3, 100 % | about 54 dB-Hz | p_detect 0.99–1.00 from 53 dB-Hz |
consistent |
| ESP32-C61, four 1 ms blocks (B = 4), 50 % point | 37–38 dB-Hz | 38.7 dB-Hz | +0.7 dB |
Both 50 % points agree with the early estimates to within 1 dB.
Discussion
Short snapshot at 80 MSa/s. The ESP32-C3 condition needs about 13 dB more C/N0 than the 4 ms conditions for the same detection probability. Its snapshot is about 0.2 ms long, one twentieth of 4 ms, which alone accounts for 10·log10(20) ≈ 13 dB of coherent integration gain.
The threshold at 80 MSa/s is probably stricter than configured. The false-alarm
measurement (False-alarm rate) was made at pfa = 0.1 and 0.01, not at the
pfa = 1e-3 used here. At 80 MSa/s it found about 0.23 times the configured rate at
pfa = 0.1 and 0.1 to 0.2 times at pfa = 0.01. Assuming, without measurement, that the
threshold is similarly strict at pfa = 1e-3, the ESP32-C3 curve sits slightly to the right of
where a threshold set for the true pfa would put it. How large the ratio is at 1e-3 is not
known. TODO: measure the false-alarm rate at pfa = 1e-3 (about 10 000 noise-only trials per
condition) to settle this. This page does not correct for the effect.
One coherent block versus four blocks on the ESP32-C61. With B = 1 the 50 % point is 0.9 dB lower than with B = 4, as expected from coherent integration over the full 4 ms. At 90 % the two are almost equal (40.4 and 40.6 dB-Hz).
Curves with one 4 ms coherent block do not settle at 1.00. navic_s_ideal stays at
p_detect 0.95–0.99 from 39 dB-Hz upwards, and the ESP32-C61 condition with B = 1 stays at
0.95–0.99 from 41 dB-Hz upwards. In both, p_wrong is 0.01–0.04 at those C/N0 values, so the
metric crosses the threshold but the peak is reported at the wrong place. The ESP32-C61
condition with B = 4 reaches 1.00 from 42 dB-Hz. Hypothesis, not verified: NavIC SPS data
symbols are 20 ms long, so a 4 ms snapshot contains a symbol edge in about one trial in five,
and the sign changes at about half of those edges. A sign change inside one coherent block
splits the correlation peak in frequency, and the strongest part can then fall more than one
frequency bin from the true carrier offset. With B = 4 the sign change affects only one 1 ms
block. TODO: confirm by repeating the B = 1 runs with the data symbols switched off, or by
checking the frequency error of the wrong detections.
How to regenerate
The four sweeps (about 8, 9, 57 and 15 minutes on one CPU core each; they can run in parallel). Every measurement setting is given explicitly, so that a later change of a command-line default does not change the result:
uv sync
uv run snappnt sweep scenarios/navic_s_esp32c3.yaml --cn0 46:60:1 --trials 200 --freq-span 40000 --blocks 1 --pfa 0.001 --seed 0 -o docs/results/pd_navic_s_esp32c3.csv
uv run snappnt sweep scenarios/navic_s_ideal.yaml --cn0 30:46:1 --trials 200 --freq-span 2000 --blocks 1 --pfa 0.001 --seed 0 -o docs/results/pd_navic_s_ideal.csv
uv run snappnt sweep scenarios/navic_s_esp32c61_4msps.yaml --cn0 30:46:1 --trials 200 --freq-span 40000 --blocks 1 --pfa 0.001 --seed 0 -o docs/results/pd_navic_s_esp32c61_4msps_b1.csv
uv run snappnt sweep scenarios/navic_s_esp32c61_4msps.yaml --cn0 30:46:1 --trials 200 --freq-span 40000 --blocks 4 --pfa 0.001 --seed 0 -o docs/results/pd_navic_s_esp32c61_4msps_b4.csv
The plot and the table of 50 % and 90 % points:
uv run --extra plot python tools/plot_pd_curves.py